FIRST: Thanks to Alan McConchie, Beth Schechter, and the Maptime team for much of this material!
Anatomy of a Web Map
FIRST: Thanks to Alan McConchie, Beth Schechter, and the Maptime team for much of this material!
Anatomy of a Web Map
What is a web map?
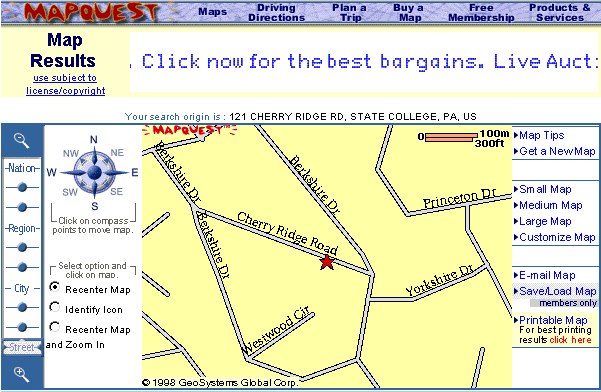
MapQuest ruled the early days of web maps
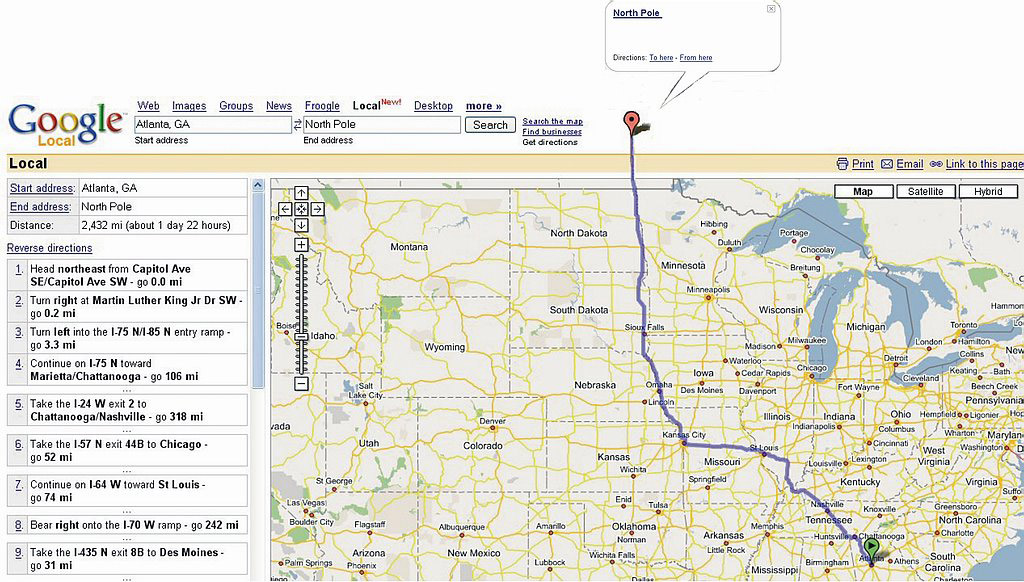
Enter Google, 2005

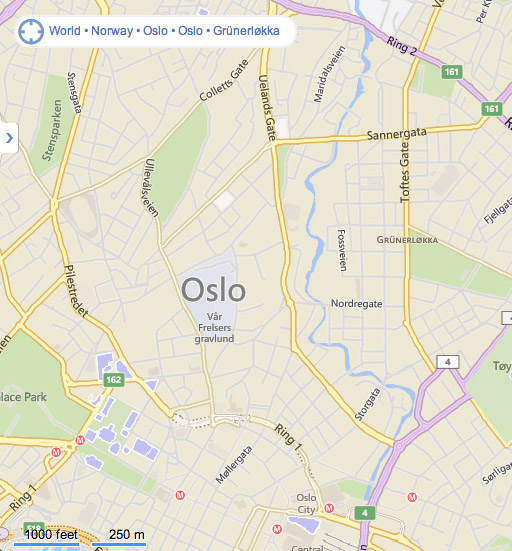
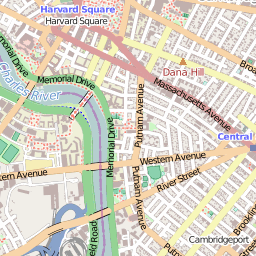
So how does a "slippy map" work?
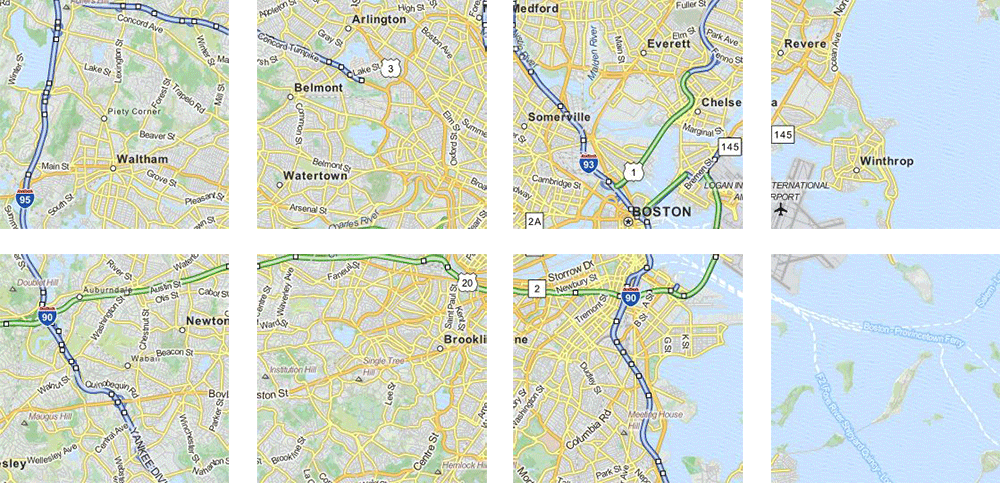
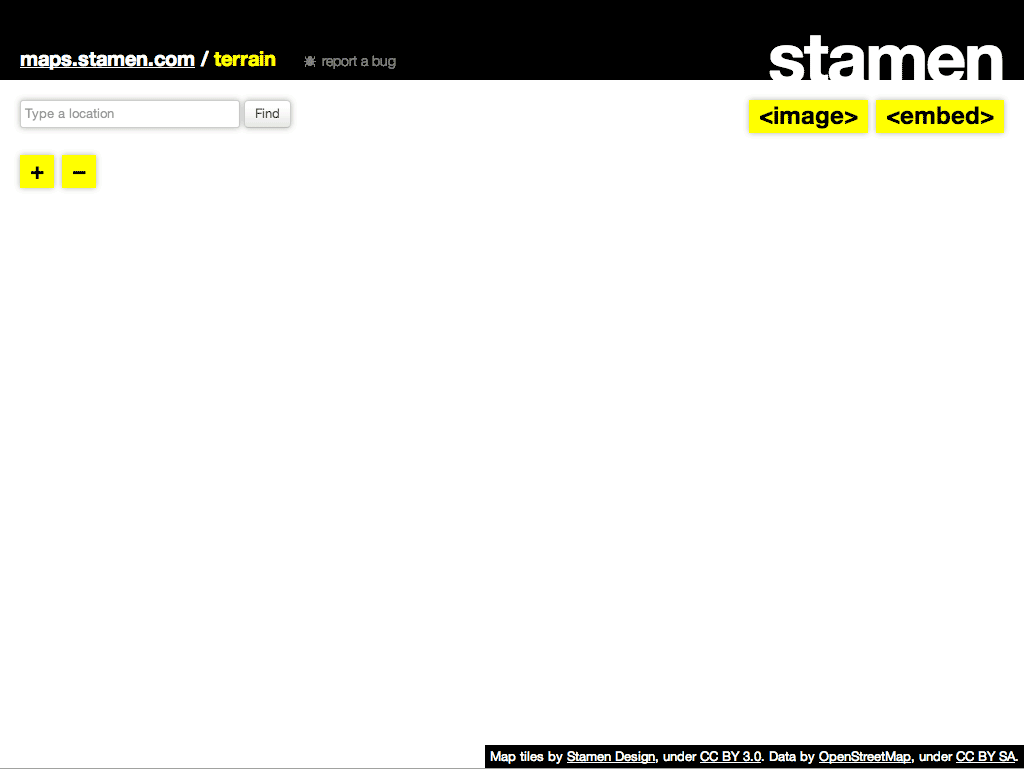
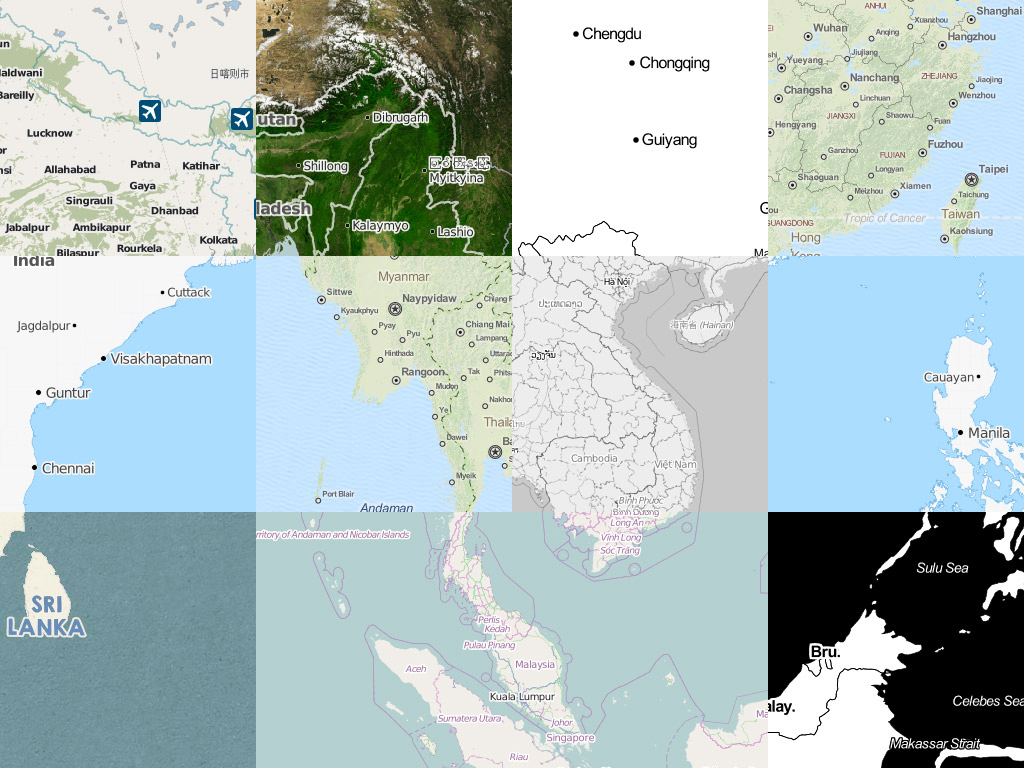
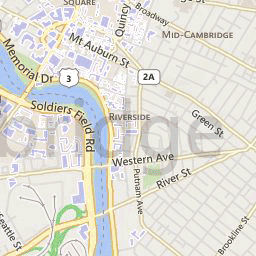
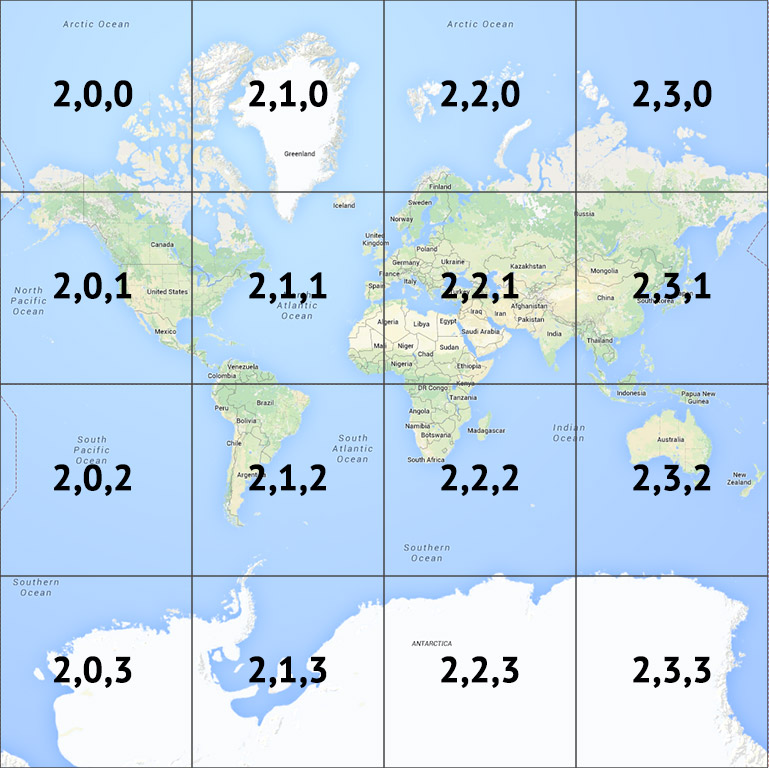
A "slippy map" is usually made of tiles.
Tiles are usually pre-rendered raster images, although vector tiles are on the rise.
256 x 256 pixels.
Standardized locations.
20ish zoom levels.

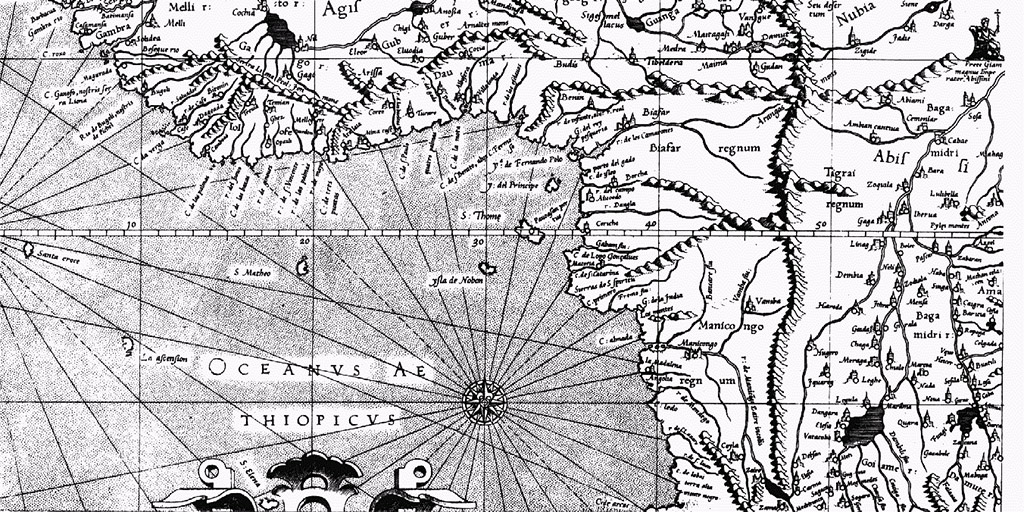
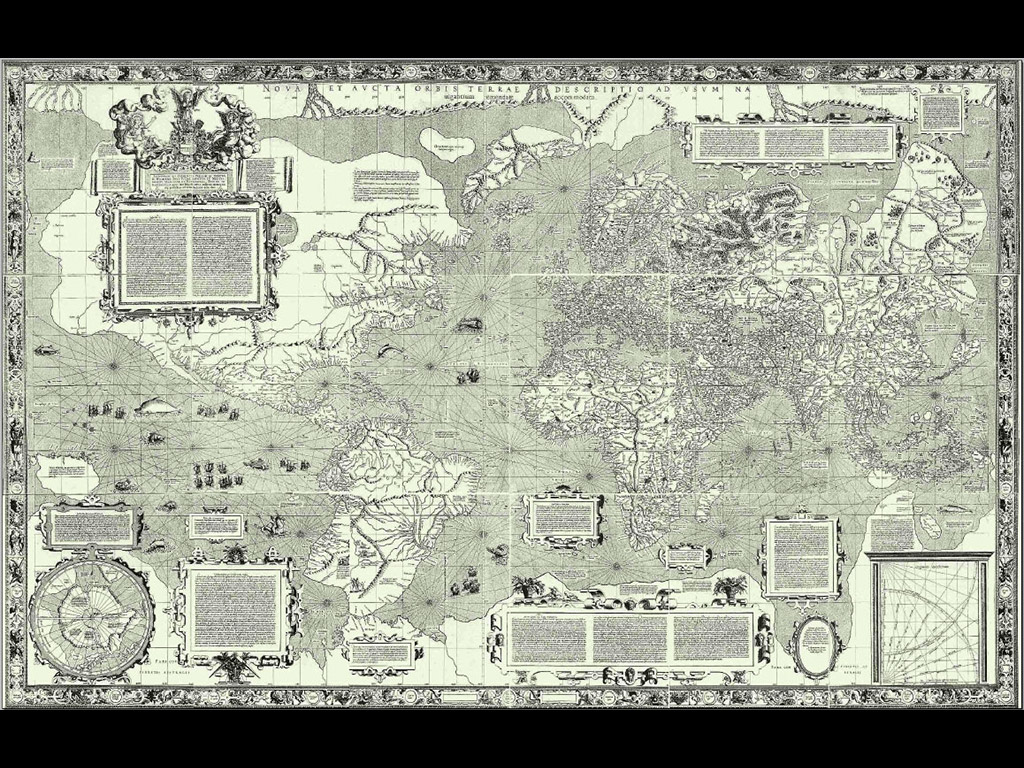
Mercator's map was designed for marine navigation. Lines of constant bearing are straight.
At a local scale, this means that shape and direction are preserved.
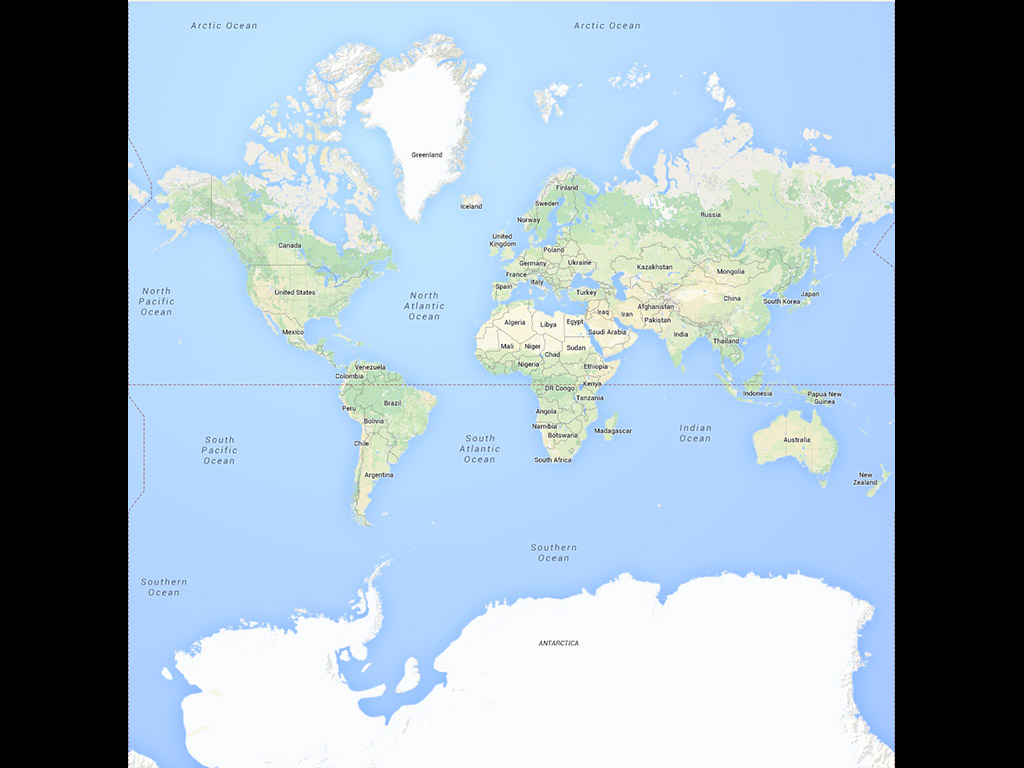
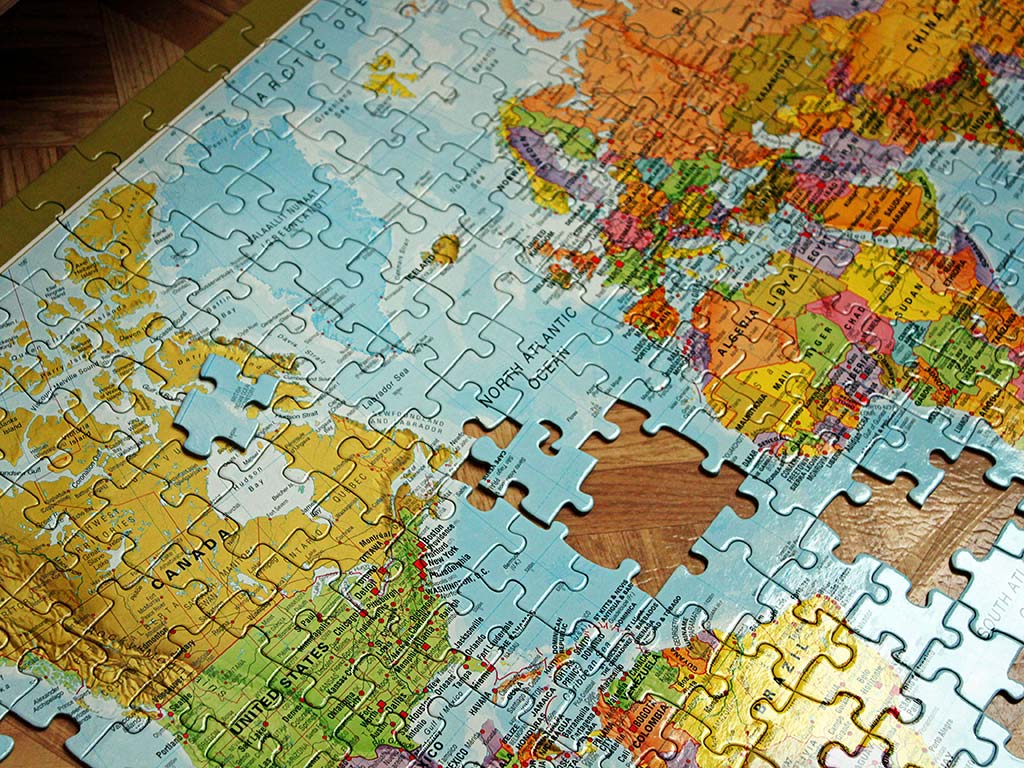
A Mercator map of the world is not a map of the world.
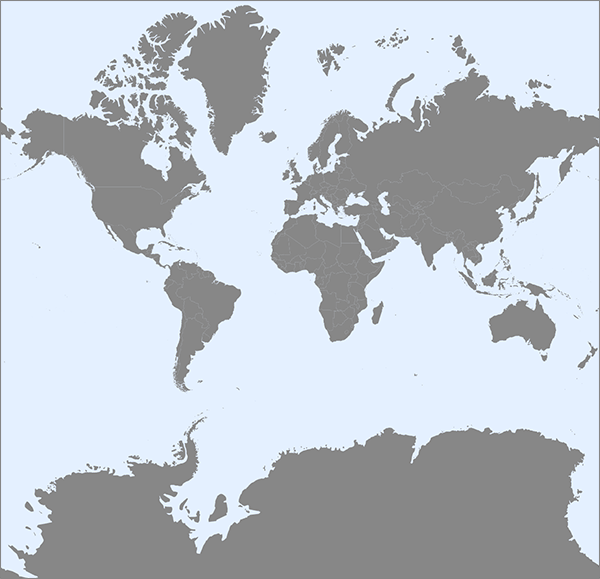

Be suspicious of web map comparisons "at the same scale."
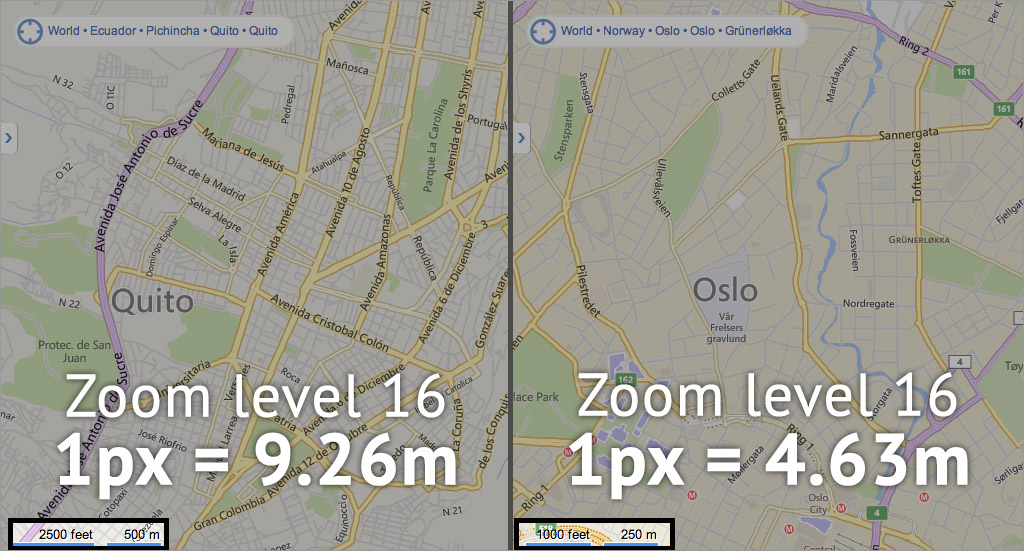
So avoid areal representations in web maps at small scale.
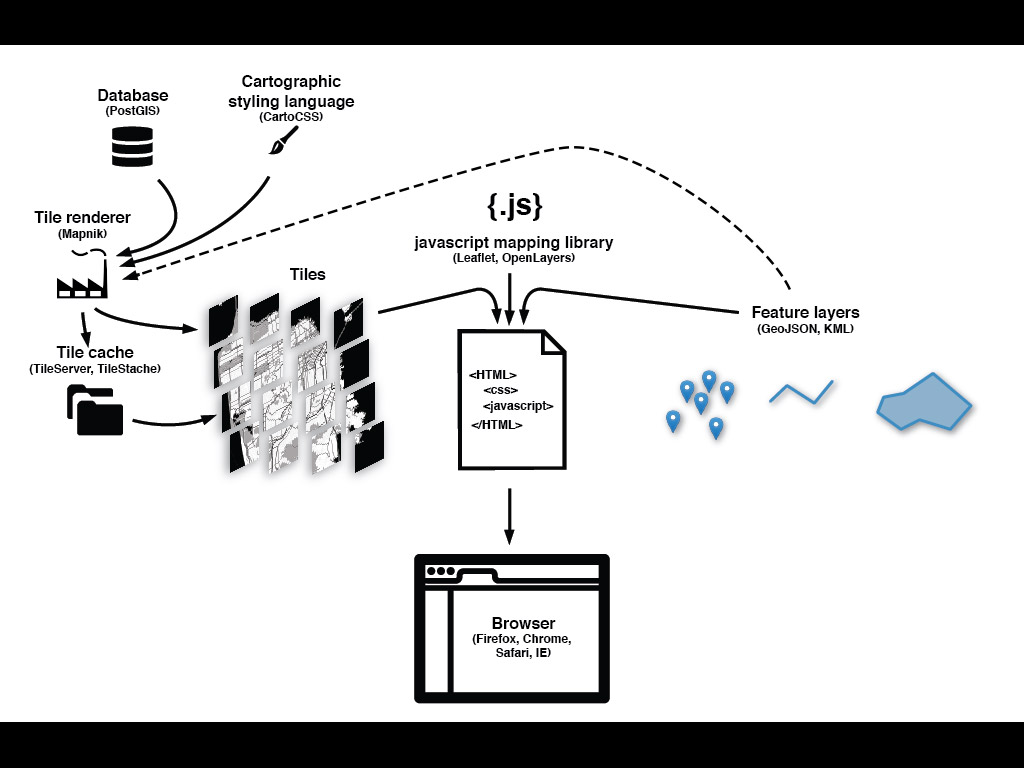
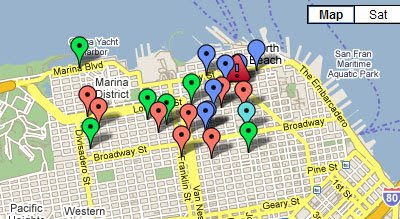
Web maps are more than just tiles.
Tiles, typically: raster, non-interactive*, used as a base layer
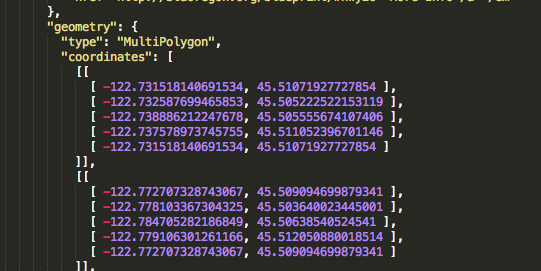
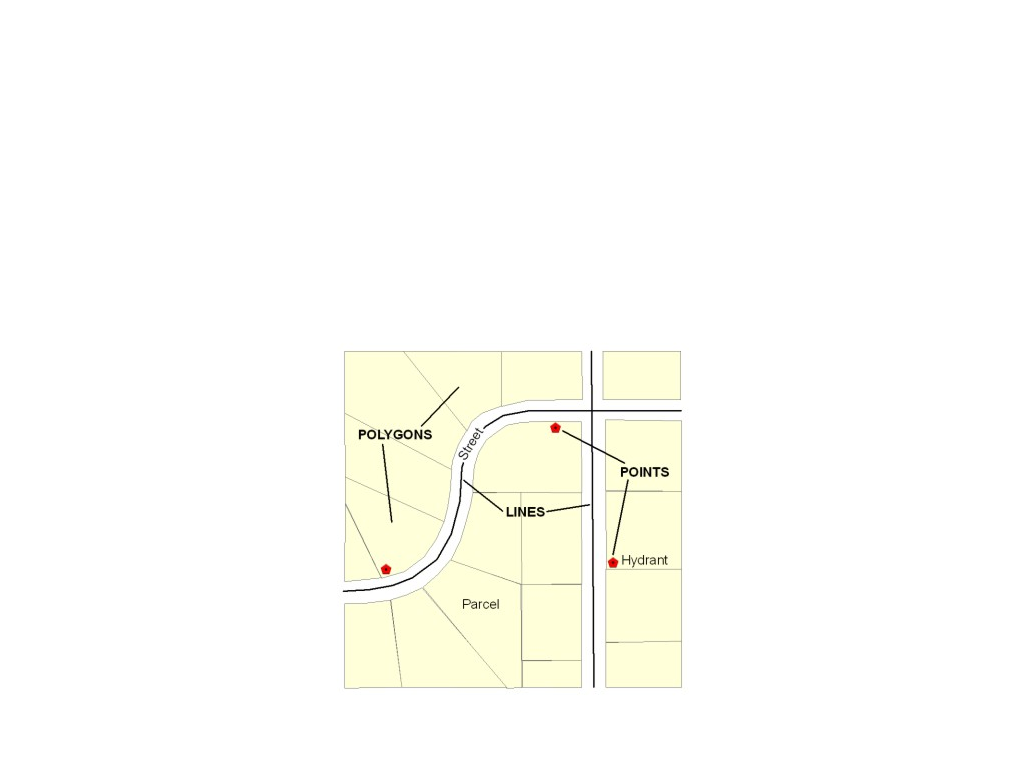
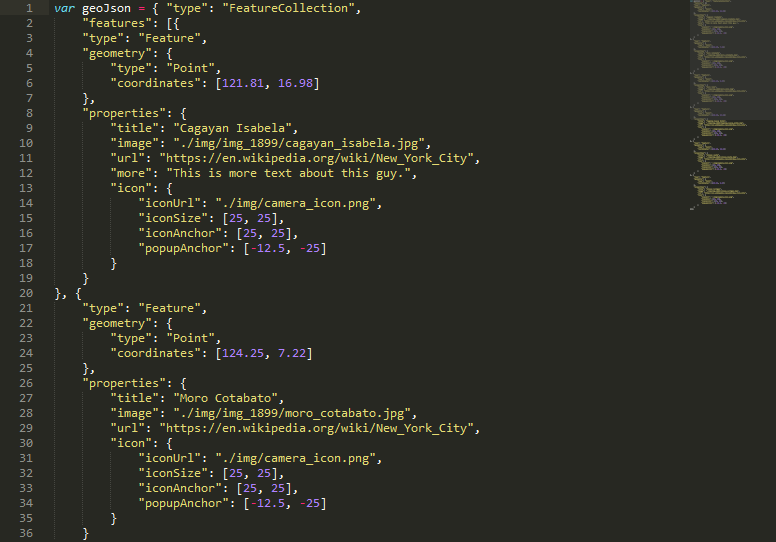
GeoJSON is a geographic data format that plays well with web maps for feature layers
How does all this fit together?
This is cool!
So where do I start?

All good maps tell stories.
What is the story you are trying to tell?
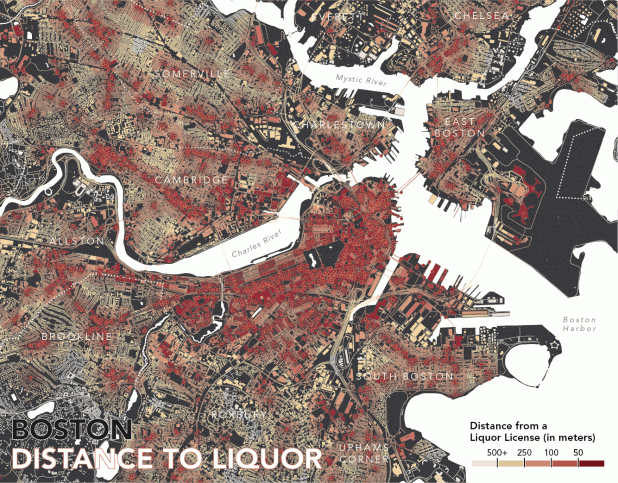
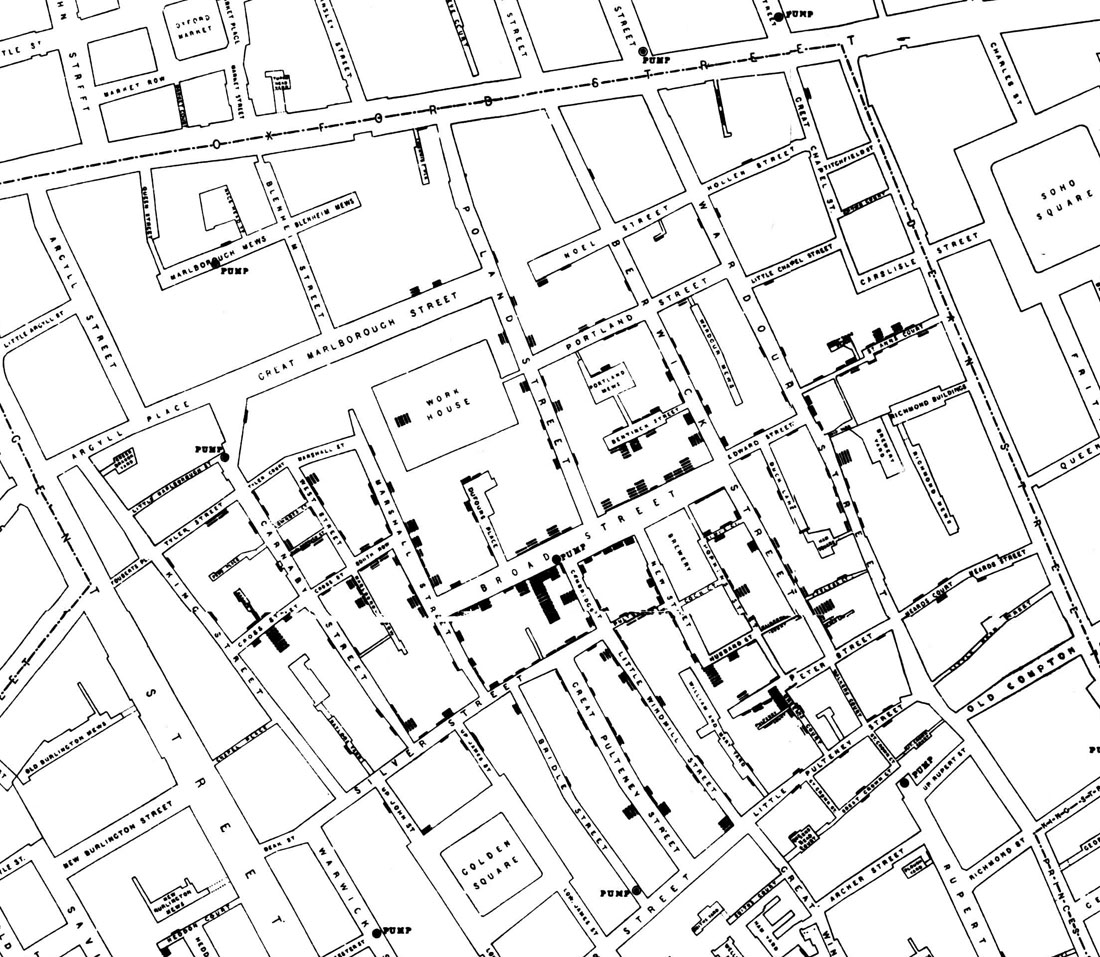
Cartographers do this.
Who is your audience?

What is your goal?
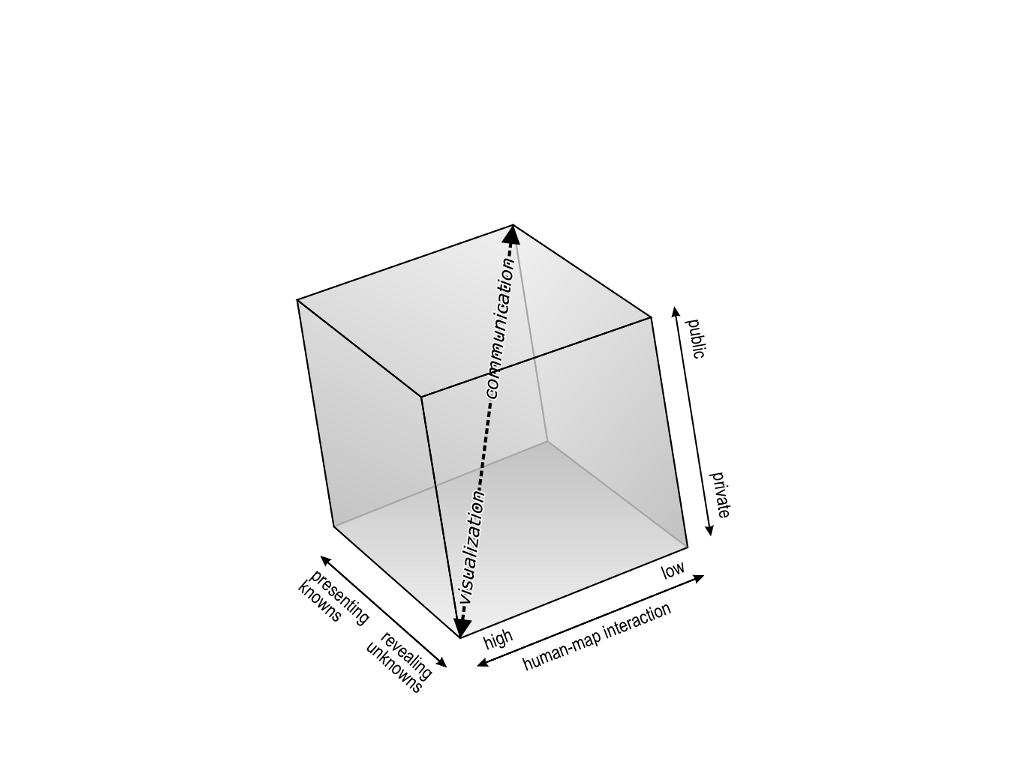
Communication Tool vs.
Exploration Tool
Data Matters
Spend the time upfront working on your data!
Interaction
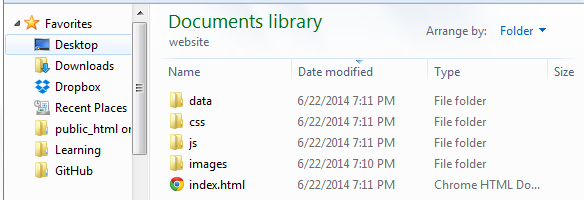
What format will you keep your data in?
We mentioned tiles...
Do you want a custom basemap?
Or can you use an existing one?
Hosting
Where are you going to put your map?
How much money do you have?

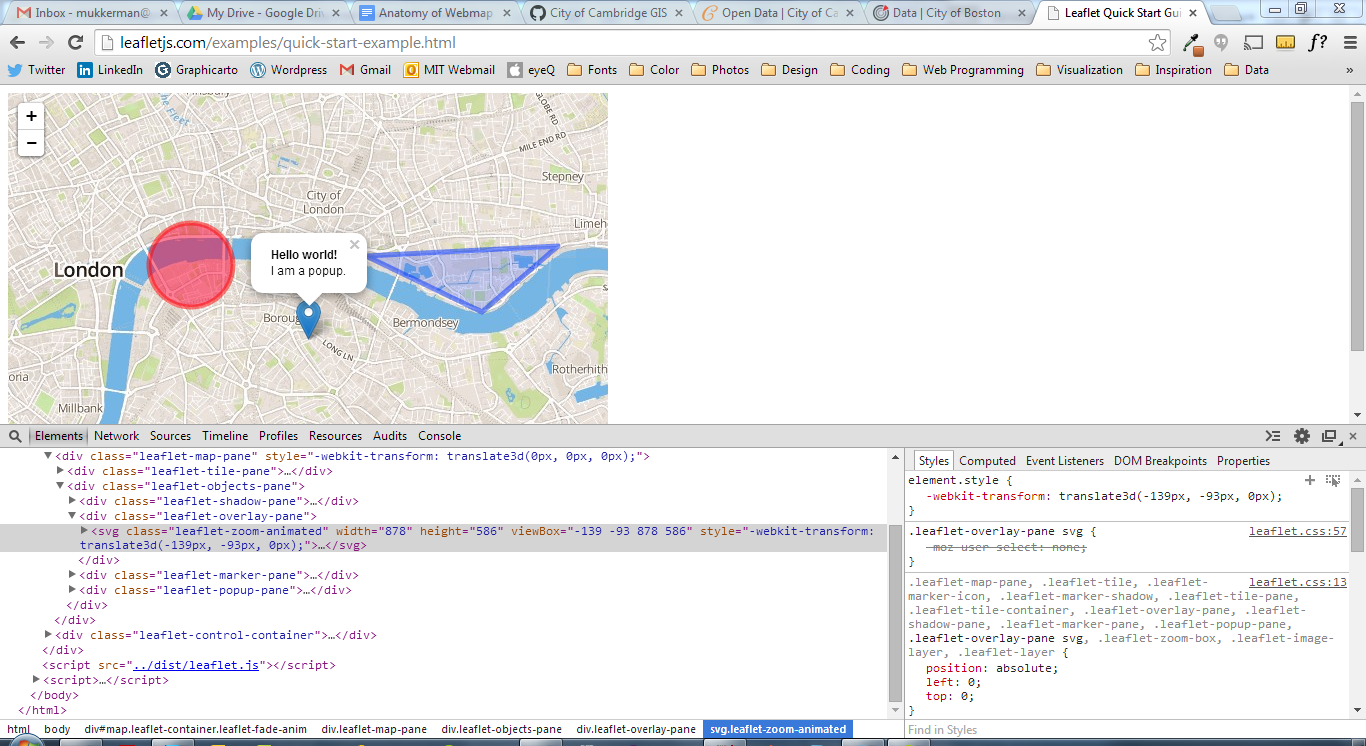
Coding
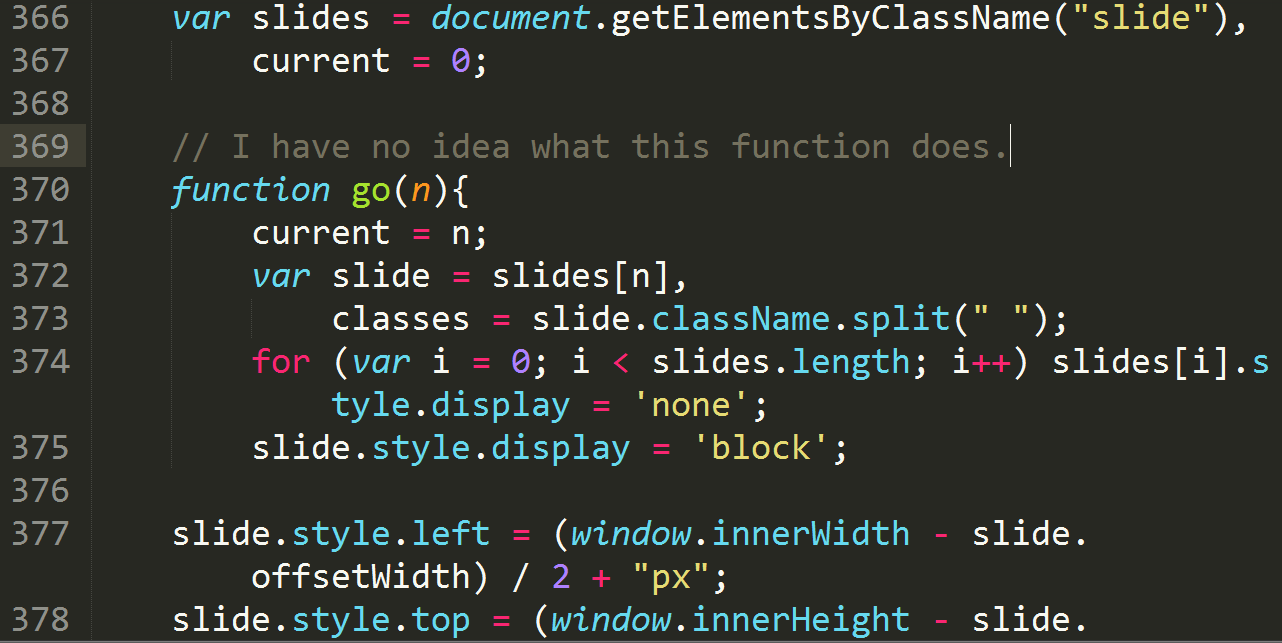
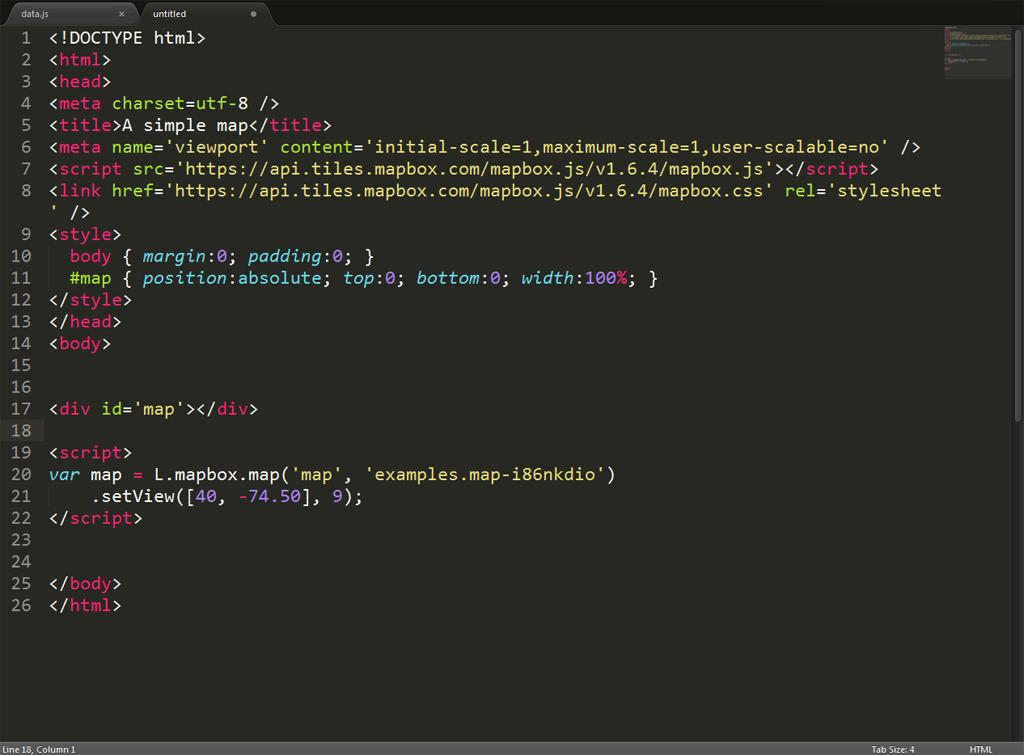
The Map Div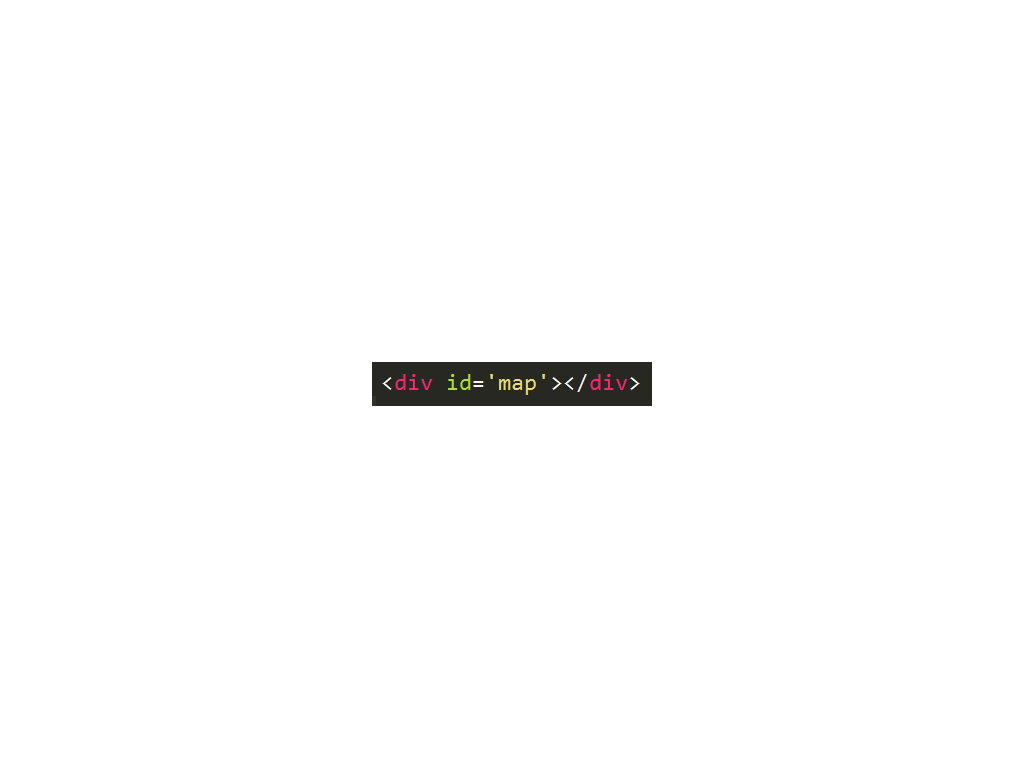
One line of code.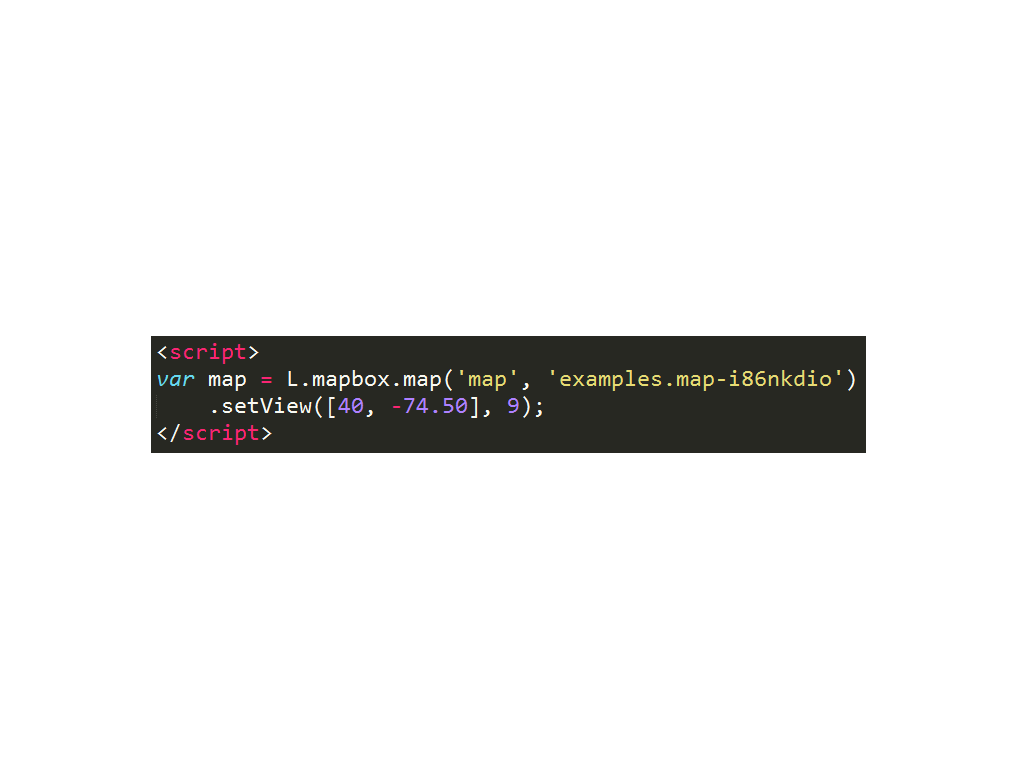
Chrome
Dev Tools
Free and Open Source GIS Software
QGIS
![]()